Reports
These are your one-stop source for all the insights gathered from the program responses. It populates data in real-time from published programs collecting responses.
|
|
|


This article will help you understand:
What are the benefits of using the Dropthought Reports tab?
How do you navigate to the Reports tab?
What are the various tabs available within Reports?
Benefits of Dropthought Reports
The extensive reports section in Dropthought slices and dices the responses received from various distribution channels for the respective program. You can:
view the responses received from each respondent.
view response trend at a question level.
view metrics and NPS trends Daily, Weekly, or Monthly.
filter and customize the reports dashboard.
download and share reports in various formats.
view correlation of each metric with NPS.
and more to it!!!
Find “Reports”
Login to your Dropthought Account.
From the Programs dashboard page, click on the Reports button from the required program card. Only published programs will have the Reports button enabled.
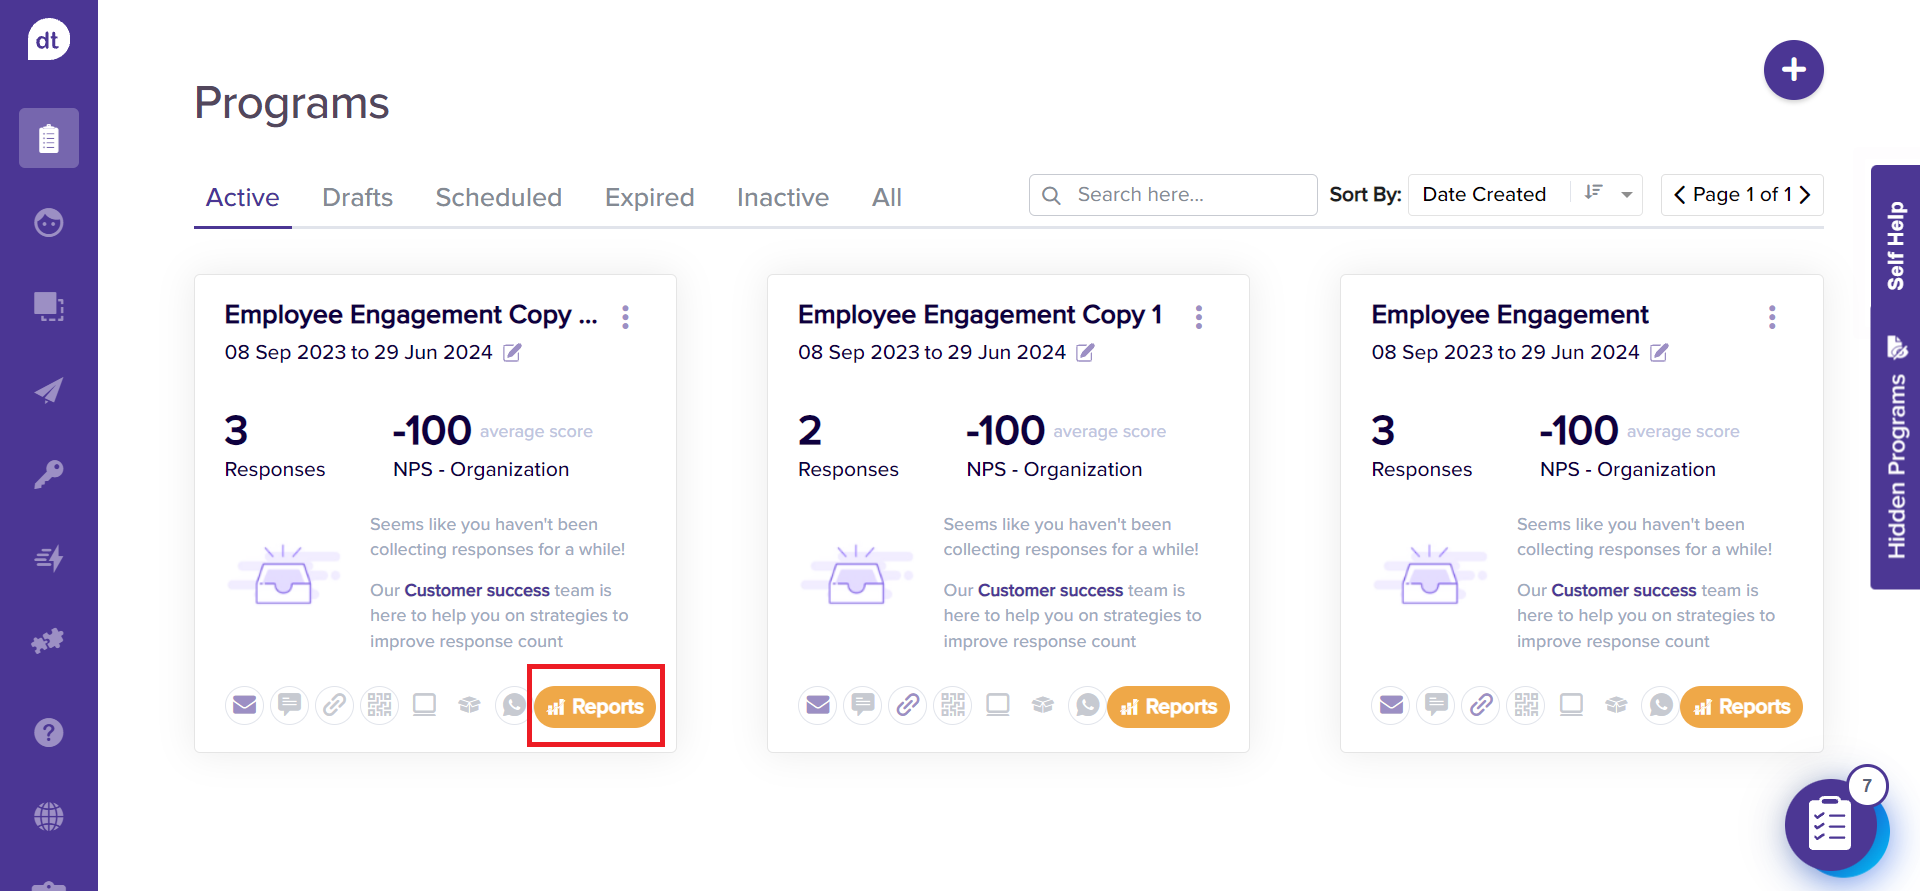
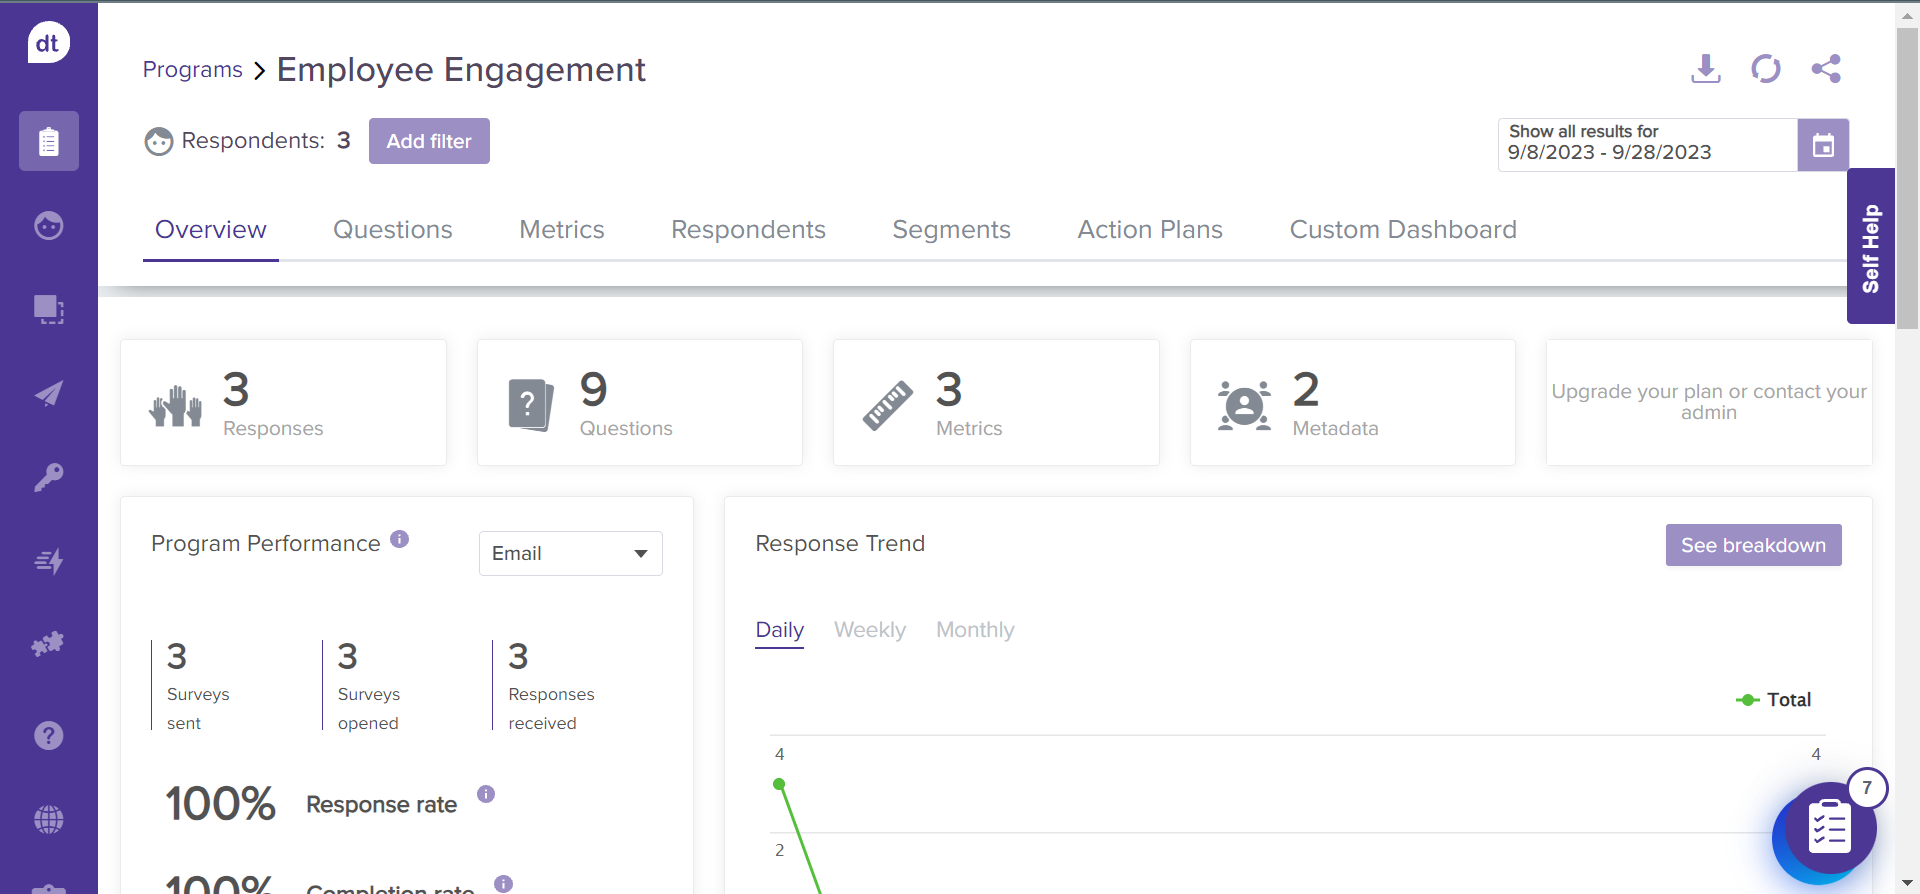
You will be taken to the program’s reports page.
Various Tabs within Dropthought Reports
Metadata: Metadata can be considered field labels with values that help distinguish the respondents. For example, Name, Employee ID, and Department can be used as metadata to identify employees.
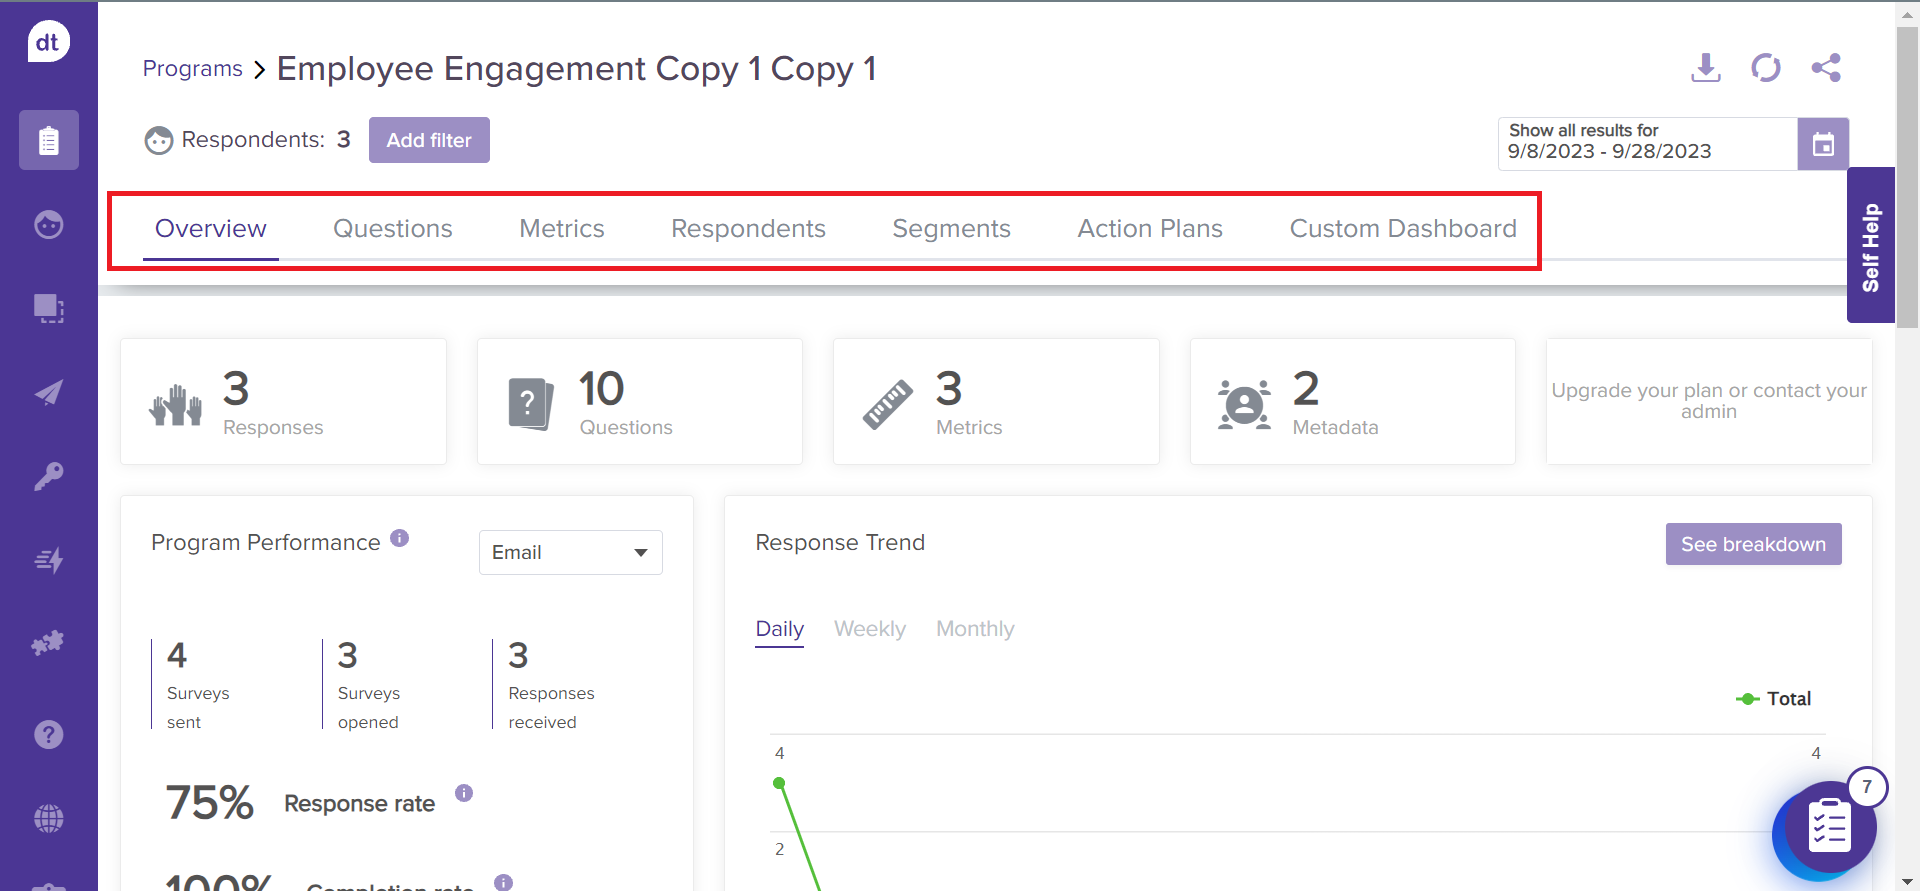
Below are the various tabs you will find within Reports. Click on the tab name to learn more about the insights available within each tab.:
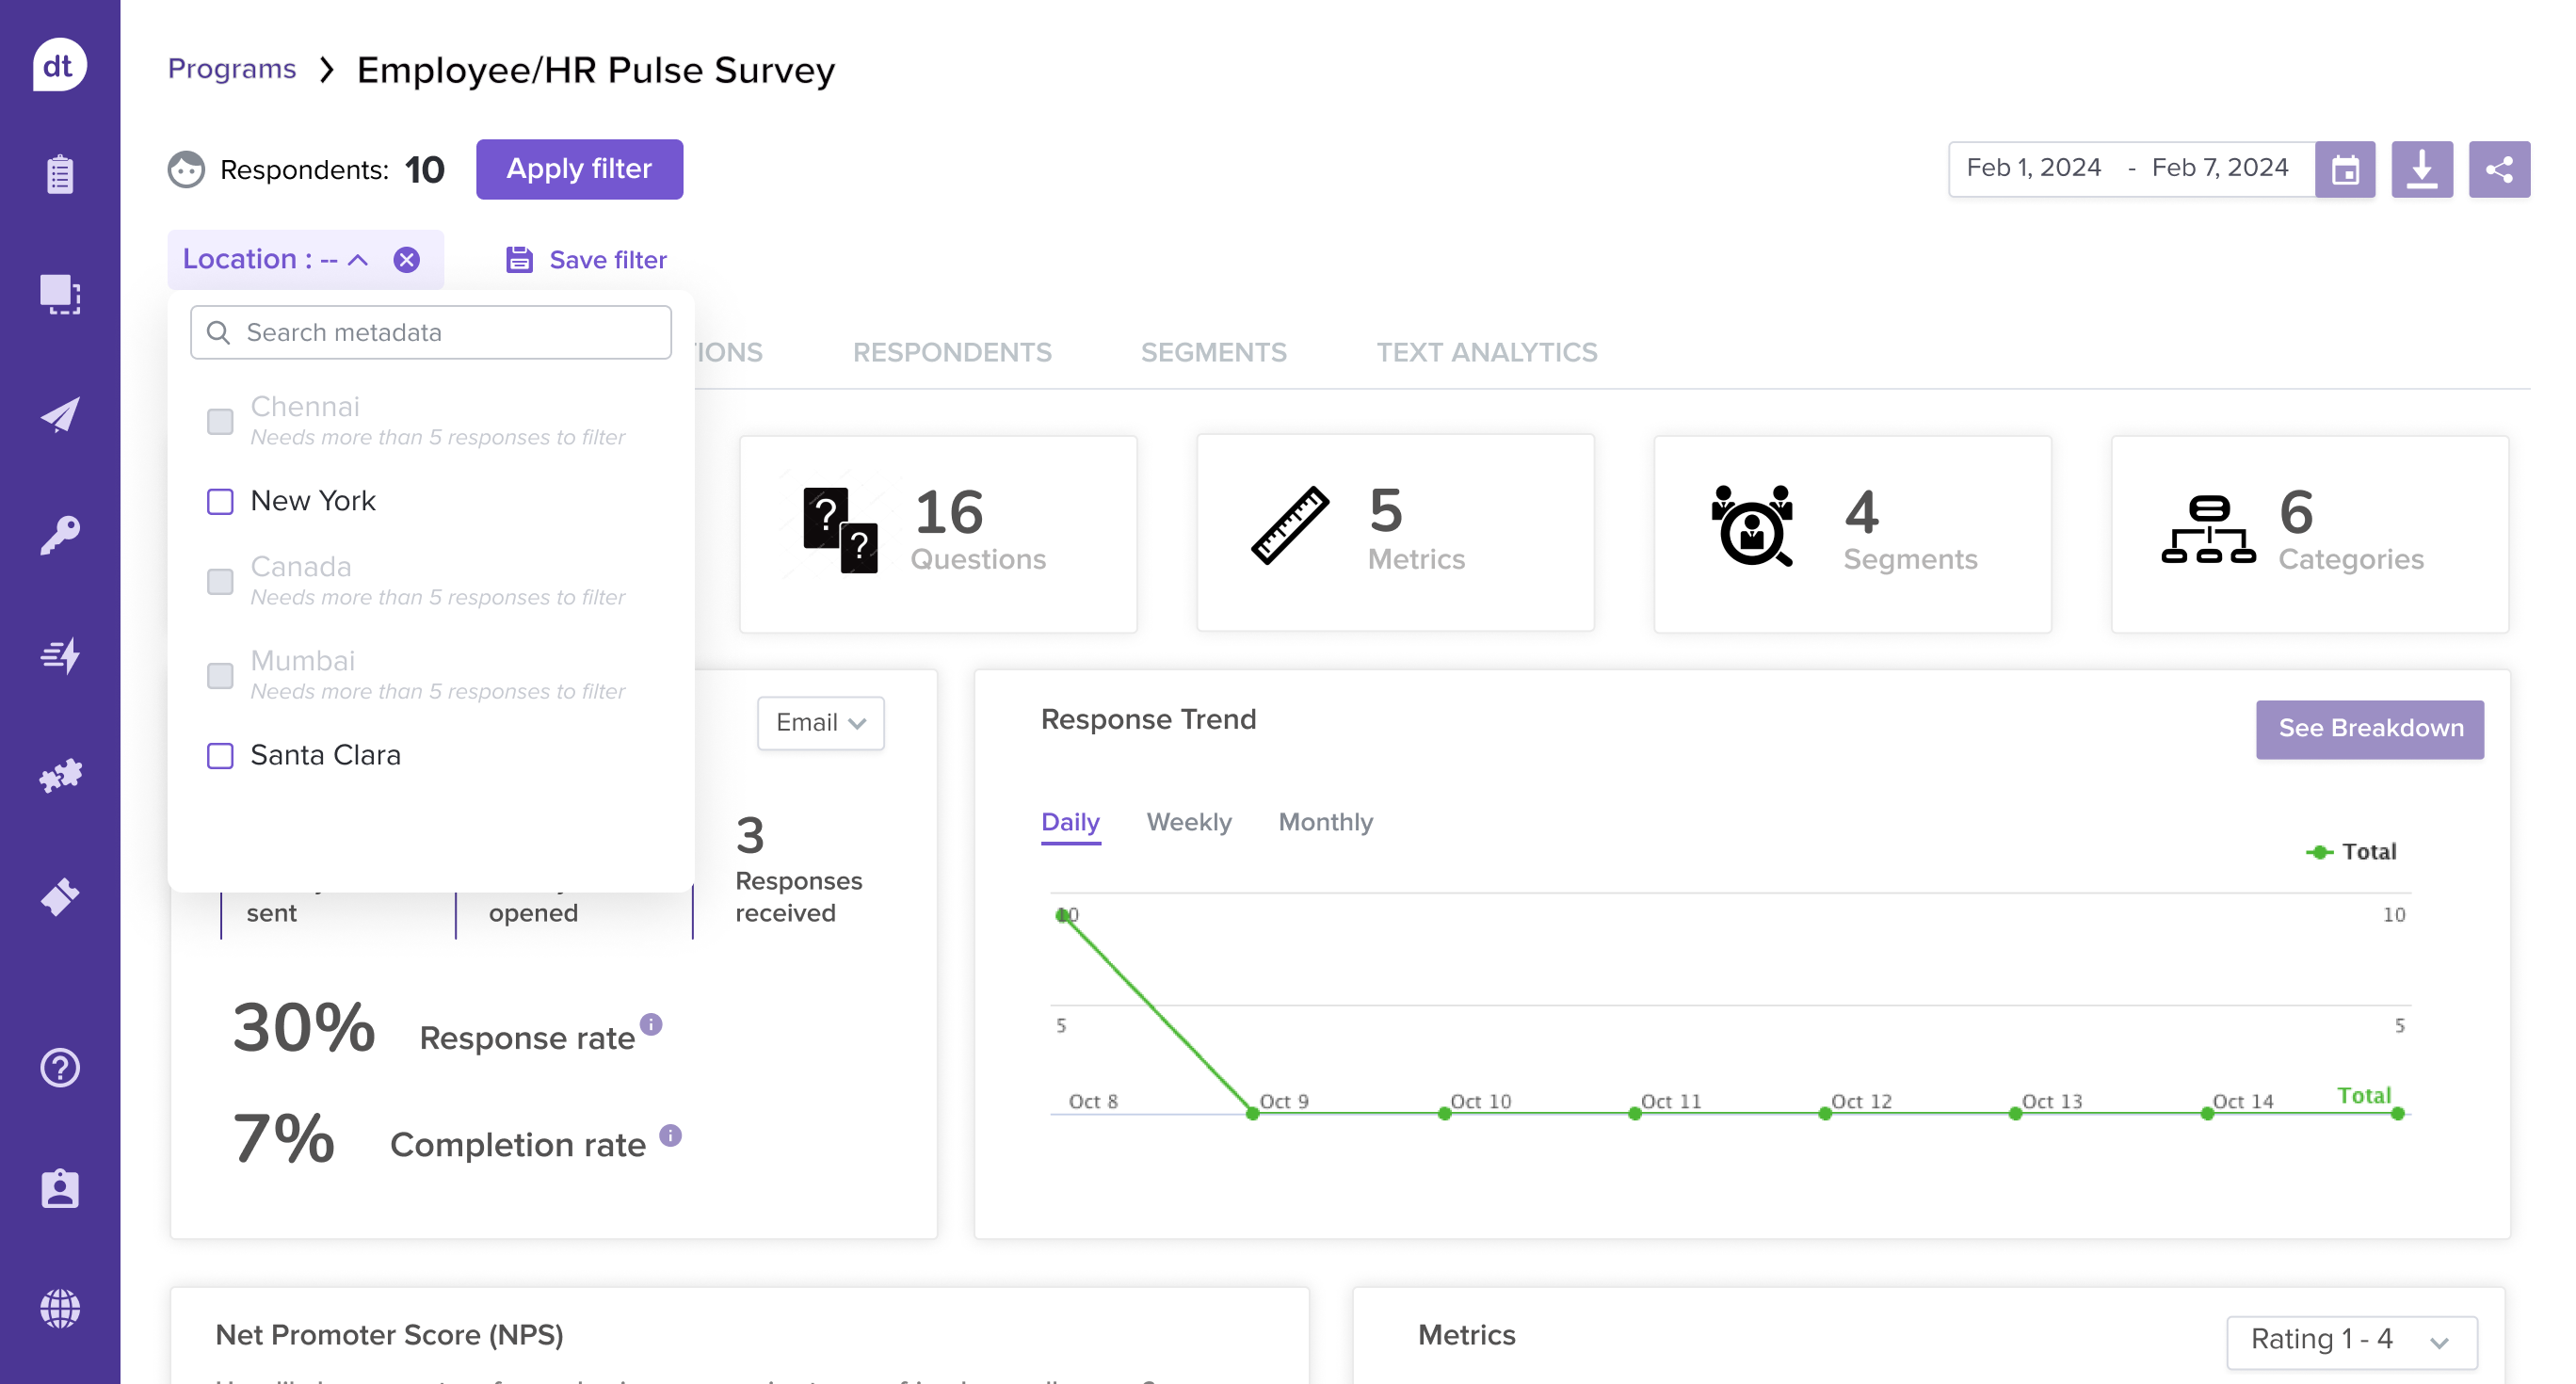
Overview: Here, you can view your program performance at a glance. It displays response rate, open count, response rate, response trend, NPS trend, and more for the selected date range.
Questions: View the question-wise breakdown of responses received for the selected date range.
Metrics: View data from all questions tied to preferred program metrics graphically, offering clear views of metric-specific scores and trends, including NPS. It also presents comparisons and trends for user-created driver metrics and outcomes for contributor questions.
Respondents: View all the responses given by each respondent for the selected date range.
Segments: View the breakdown of response count and ratings received at a metadata level. Select a metadata and view the related count in tabular form.
Analytics Tab ADD-ON : View text analysis of responses from open-ended questions. You can select a question to view its categories and sentiments received. They can also collectively access overall sentiment analysis for all open-ended questions and separate sentiment analysis for each question.
Action Plans ADD-ON : View insights into areas for improvement and suggest actionable steps to achieve optimal results. You can assign tasks, set deadlines, and monitor progress effectively.
Custom Dashboard
Note:
If no or fewer than five responses are collected for the anonymous survey:
The report tabs will display an empty state message, as shown in the screenshot below.
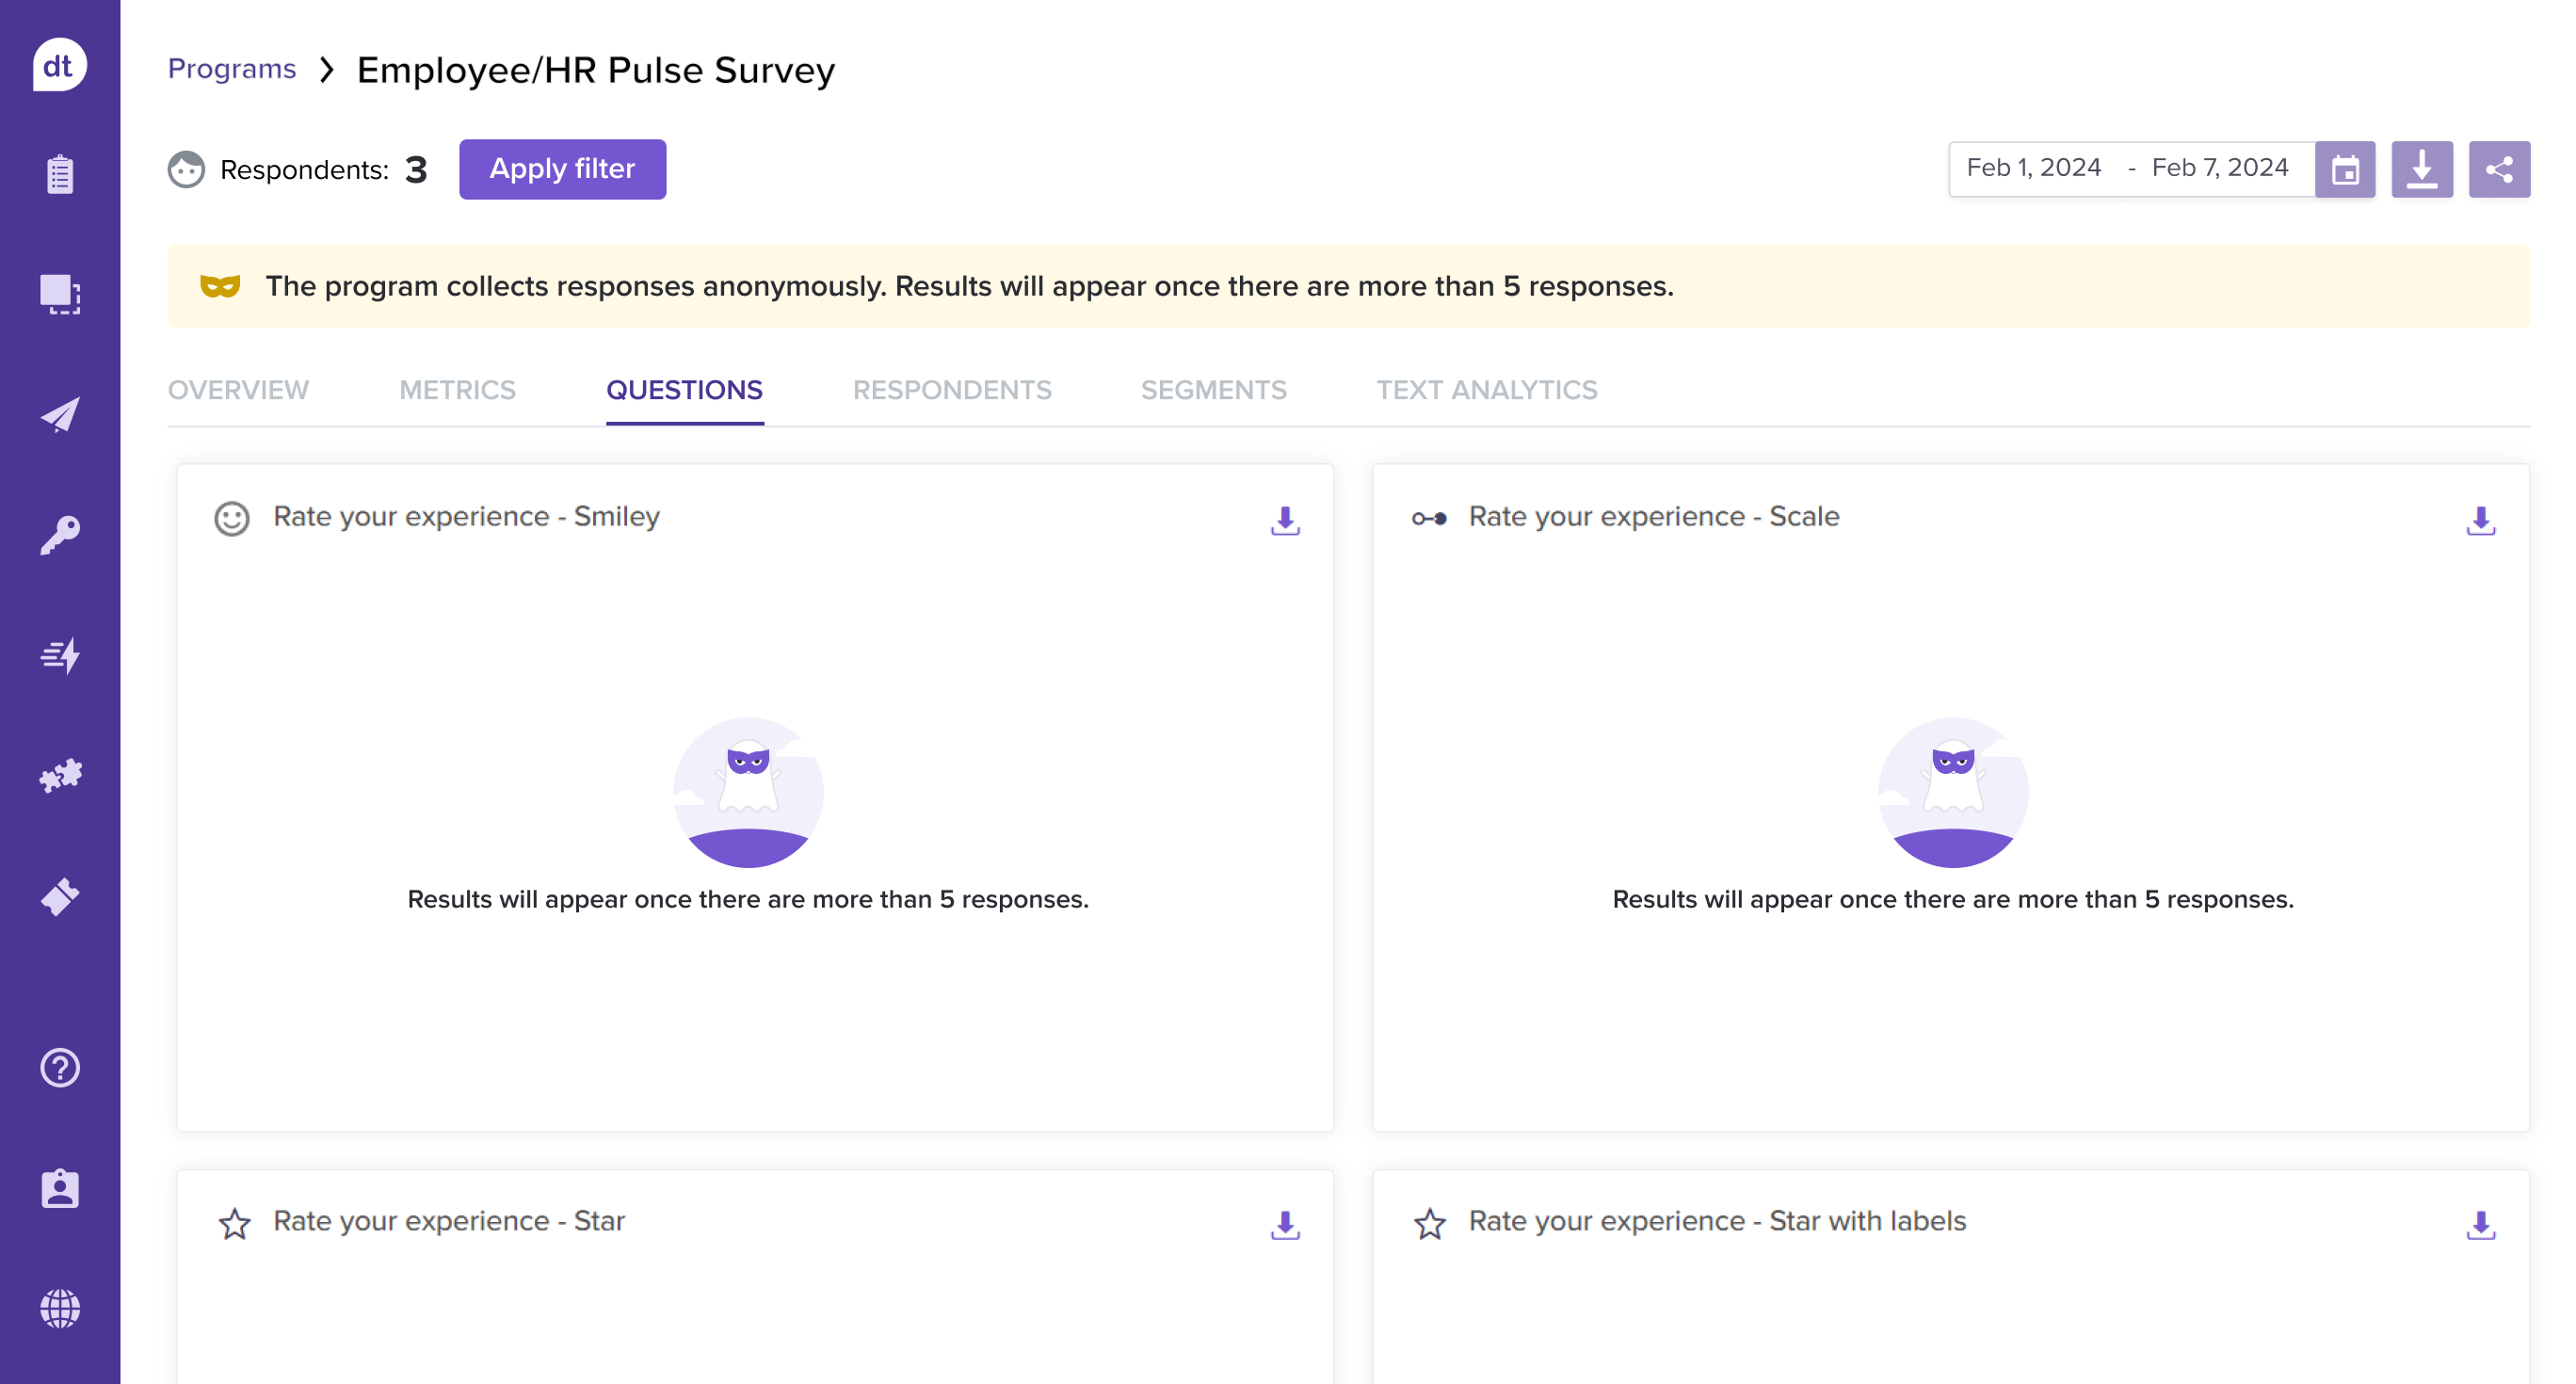
Metadata will be disabled on the filters.
Learn more: Apply & Save Filters |Share Reports | Download Reports | Analyze Reports