Segments Tab
|
|
|

Segments in Dropthought break down the response count and ratings received at a metadata level. You can select a metadata and view the related count in tabular form.
Metadata can be considered field labels with values that can help distinguish the respondents. For example, Name, Employee ID, and Department can be used as metadata to identify employees.
This article will help you understand:
What are the various details shown in the Segments tab?
How do you read the data shown?
Following are the various details you can view from the Segments Tab:
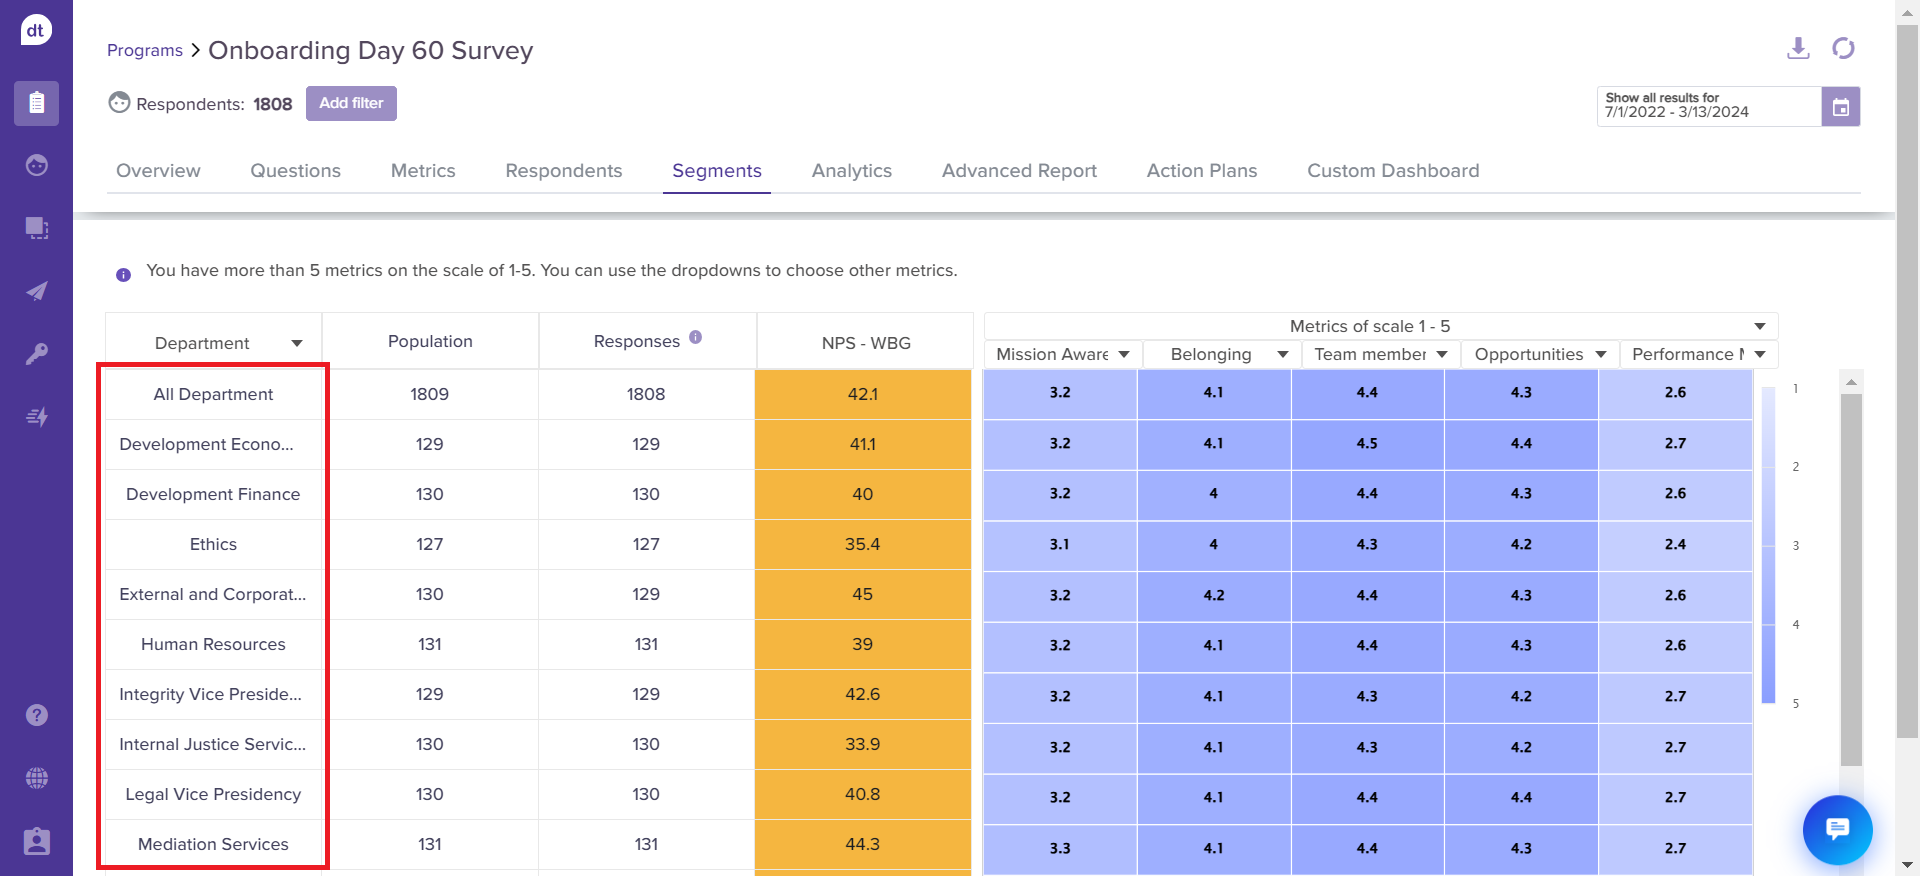
Metadata
The user can switch between metadata from the dropdown menu on the table's first cell. Based on the selection, the table will be generated based on the values available for that metadata, with each row representing one segment.
Population (Total responses received)
Count (Total responses - Responses received via a shareable link, kiosk, and QR)
NPS (out of 100): These are color-coded based on Promoters, Passives, and Detractors.
Metrics: Users can view all the metric ratings received. These are displayed in a tabular form with metric names as column headers and metric ratings received from the corresponding metadata (row name). Hovering over each count will display corresponding metadata, metrics, and ratings.
The user can select a rating scale from the top drop-down menu. Upon selecting, the 5 columns below will be auto-populated with metrics measured on the selected scale.
In case of more than 5 metrics being measured, they can use the drop-down menu on the column header to mix and match the data.
You can sort the segments using the “Sort by” option on the column headers.
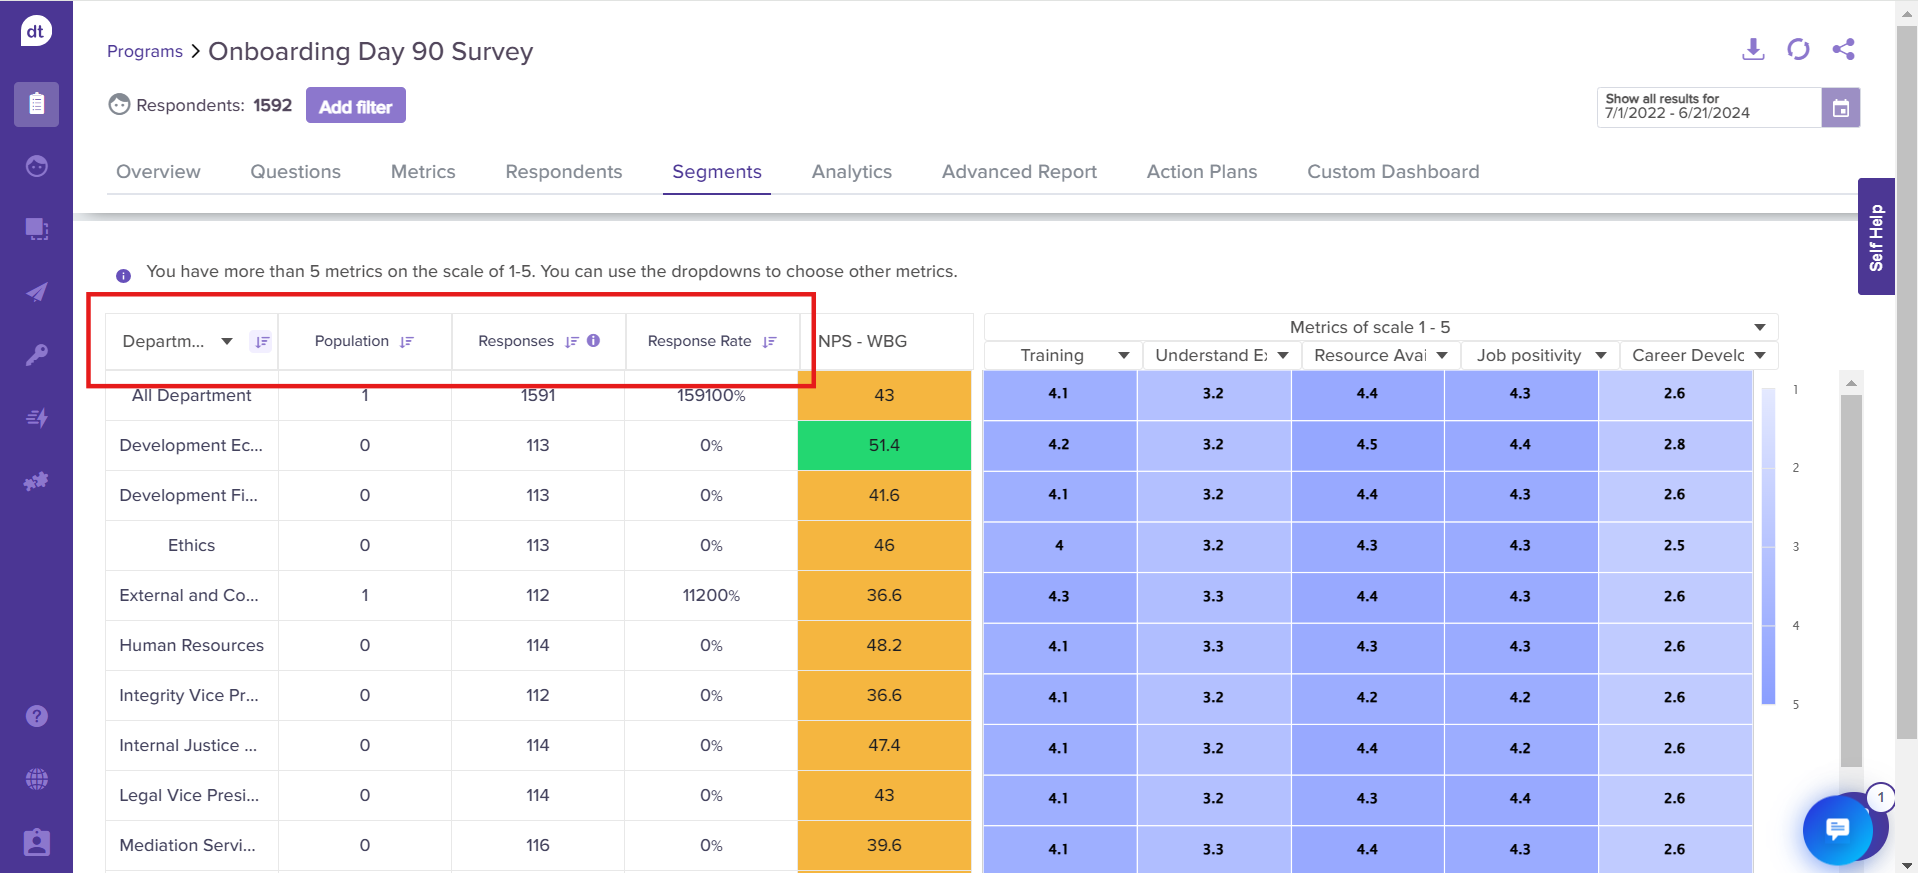
Studies recommend not to use more than 5 metrics to compare.
True comparison cannot happen between more than 5 at a time, and comparing metrics of various scales can lead to inaccurate comparison.
Function |
|---|
Add/Remove metadata from the dropdown |
View metadata, metric and rating from the metrics table |
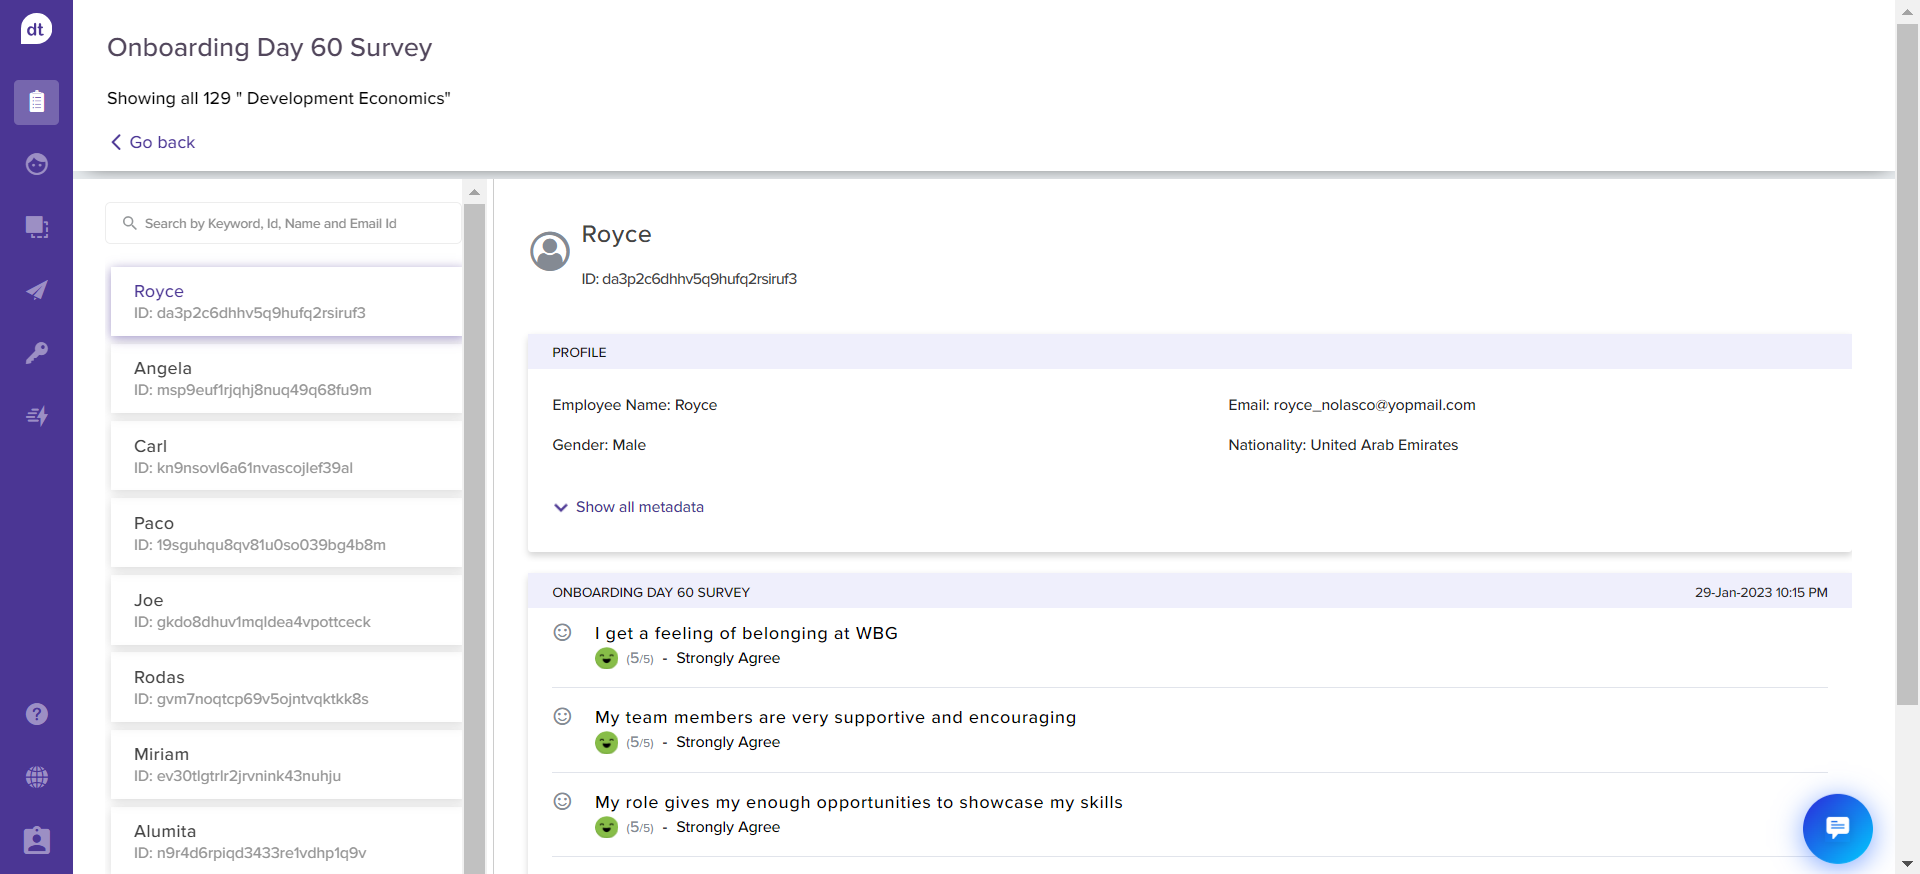
View Respondents
You can drill down and view respondents and their responses within a segment from the Segments tab.
Click on the required metadata from the Segments table.
You will be redirected to the list of respondents with their responses.
Note: Download Report
The Segments Tab in downloaded reports provides a detailed visual representation of segment-wise data.
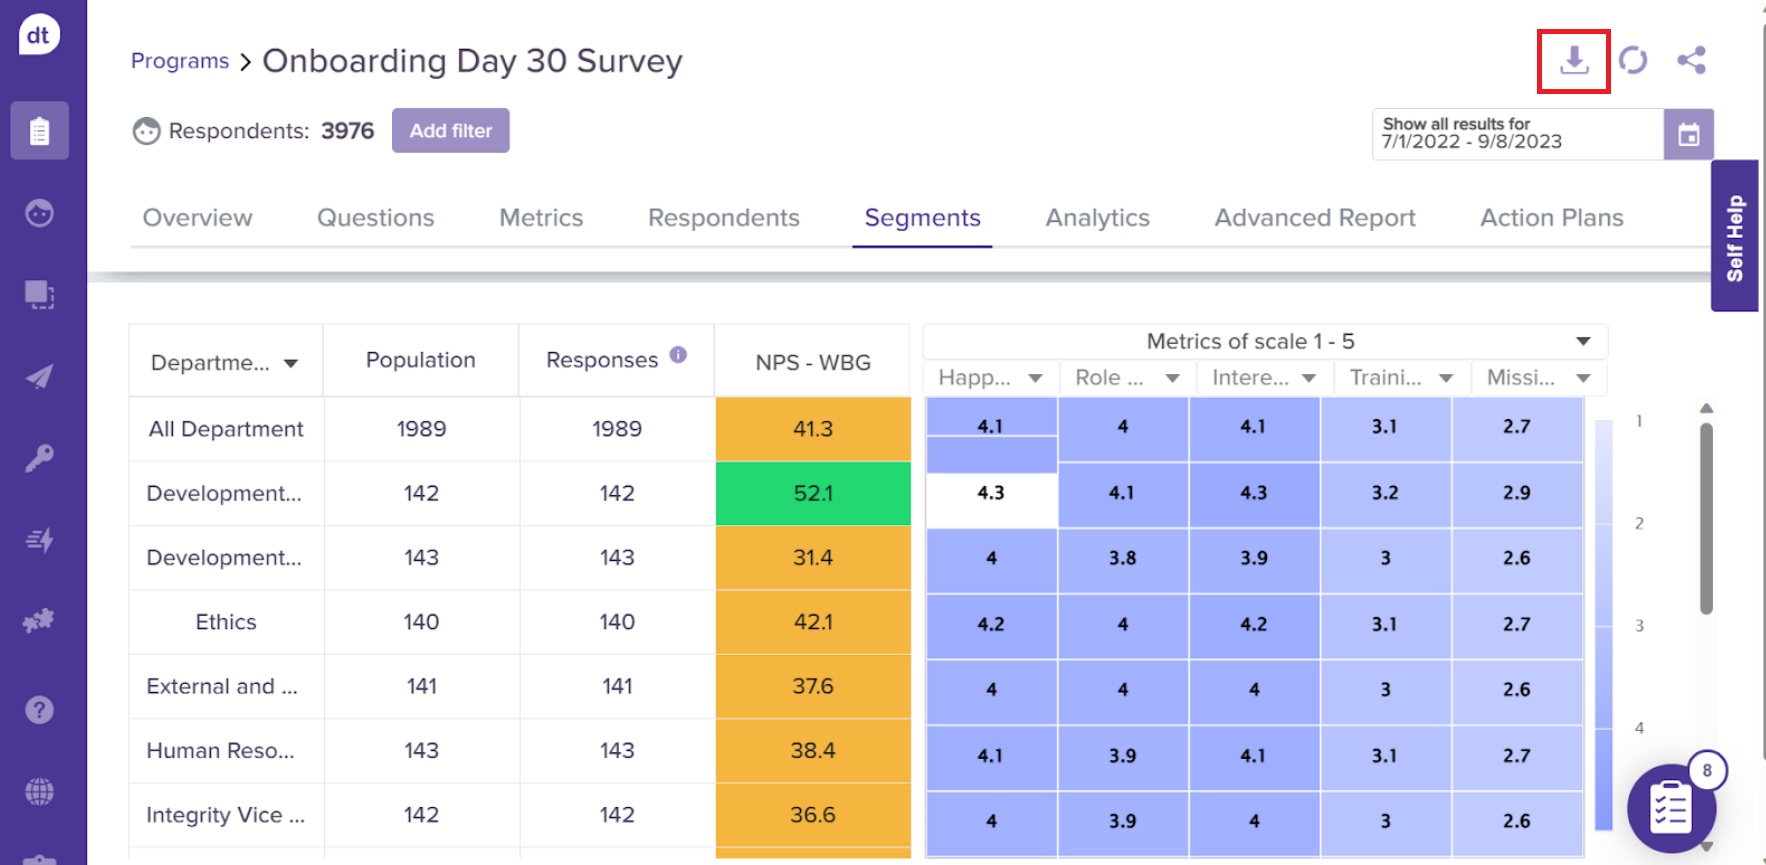
NPS Breakdown: A table shows the number of Promoters, Passives, and Detractors, along with the population, responses, and response rate for each segment.
Metrics Breakdown: A separate table displays the rating scales, population, responses, and response rate for different metrics.
Metadata Tables: Each metadata header has a table that offers a detailed view of segment-specific data.