Overview Tab
|
|
|


As the name suggests, the Overview Tab summarizes various aspects of the responses.
This article will help you understand:
What are the various components displayed on the table?
How do you read the results?
What is the importance of each component shown within the tab?
Program Performance
Importance
The number of responses is important to understand the response and abandonment rates. This will help users to know how they captured the attention of the respondent or not. If the response rate is low or the abandonment rate is high, this signifies a problem either in the program or how the program is distributed.
How to Use
Performance Overview: The data provides you with the rate of response and abandonment to pinpoint problems in your programs, distribution channels, or strategies. This will help you to iterate and restrategize to have a higher response rate and resonate better with your respondents.
Optimization: All these numbers can help you understand the best-performing distribution channel, which question type has gathered maximum responses, and the length of programs with better results.
It summarises the response rate and completion rate for every distribution channel:
Response Trend
It is a graphical representation of changes in the response rates over a time period, like daily, weekly, or monthly.
Importance
Trends have always indicated the “what” behind collective actions. Like any other trend, response trends help you understand how your respondents react to your programs. Email is the best channel over time, while SMS only works for Tuesdays. This is the place to uncover your target demographic's unique movements and preferences.
How to Use
Performance Overview: This graph will help you visualize response patterns like the best times to collect more responses, hence restrategize and develop an action plan to get the most out of your target audience. This graph shows, realistically, how your respondent demographic is inclined to respond.
Optimization: This graph will help you determine the best times to publish a program within a week, month, and year. Maybe your respondents are better with spending time on a program that is distributed every quarter rather than monthly. Perhaps the best time is Friday because there are fewer meetings. Using this trend graph, you can optimize the best time to get the most out of your target audience.
Further, the data can be viewed based on:
Total breakdown
Various distribution channels
Net Promoter Score
Importance
NPS is a widely used metric in the industry to gauge customer loyalty and satisfaction. The most straightforward method gives you a perspective on various issues in your business/company. It is a valuable tool for understanding and improving customer loyalty and can contribute to long-term business success.
How to Use
Measuring Customer Loyalty: NPS provides a straightforward and quantifiable way to measure customer loyalty and satisfaction.
Identifying Areas for Improvement: By categorizing customers into promoters, passives, and detractors, you can pinpoint which aspects of your product or service need improvement.
Comparing Performance: To assess your relative performance, you can compare your NPS with industry benchmarks or competitors.
Predicting Growth: Studies have shown a strong correlation between high NPS scores and business growth. Satisfied customers are more likely to buy and stay with a company longer.
Actionable Feedback: NPS feedback is often accompanied by open-ended comments, which provide qualitative insights that can be used to make specific improvements.
Segment and Understand: Segment your customer base to understand which demographics or customer segments have the highest and lowest NPS scores. This can help you tailor your strategies.
Track Progress: Regularly measure NPS to track improvements and see how your changes affect customer loyalty.
Integrate with Other Metrics: You can use NPS alongside key metrics like Customer Satisfaction (CSAT) and Customer Effort Score (CES) to gain a more comprehensive view of your customers' experiences. You can also create driver metrics, and Dropthought will cross-tabulate these with NPS to tell you which of your drivers directly correlate with NPS so you can prioritize your focus areas and take faster action.
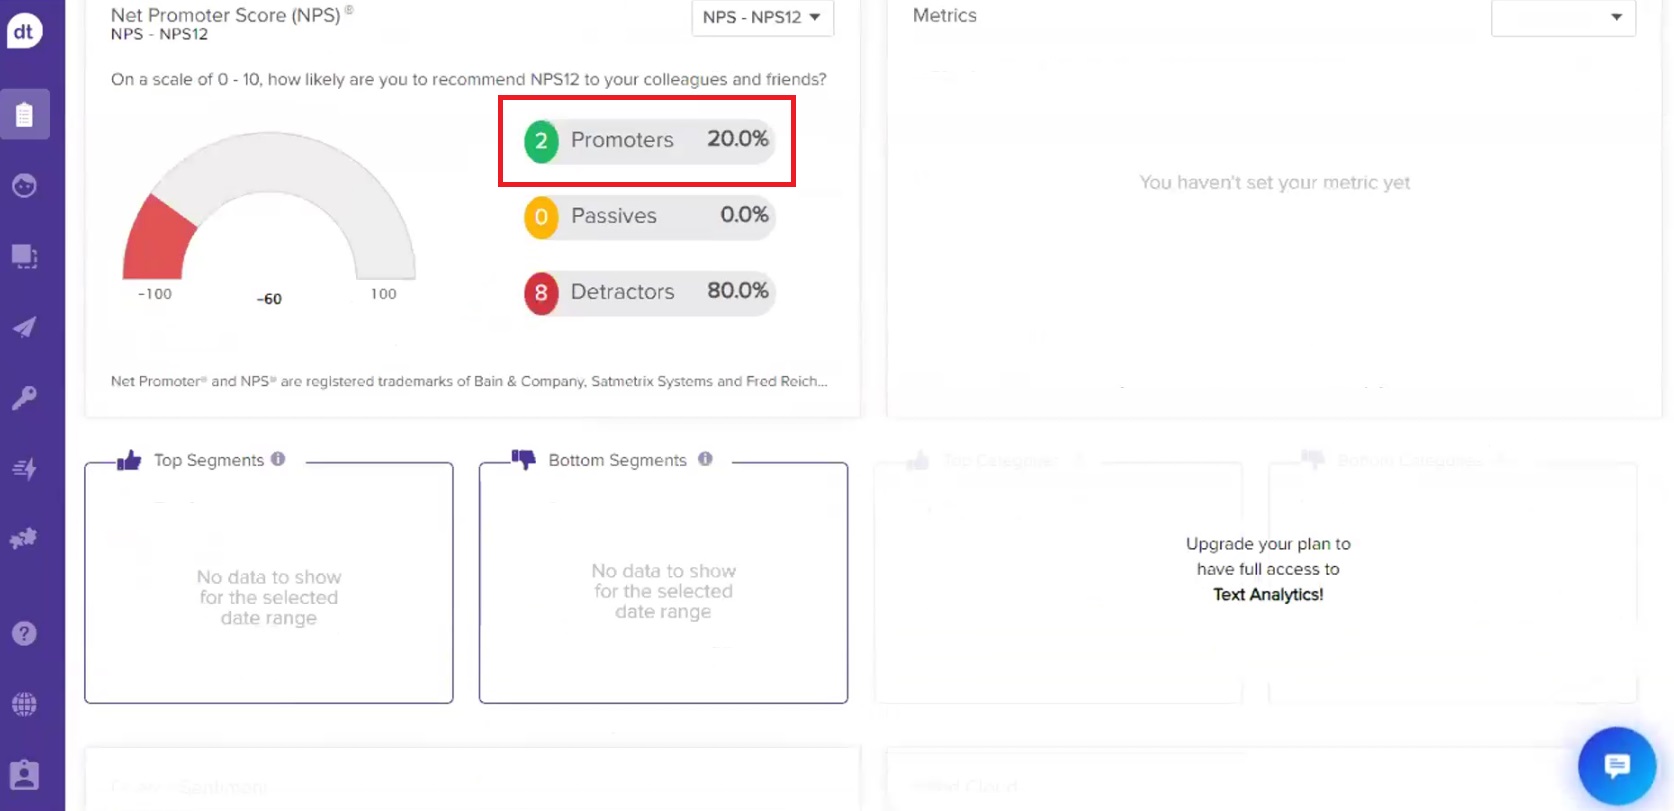
The section summarizes the NPS rating received through the program. It breaks down the percentage of Promoters, Passives, and Detractors.
View Respondants for NPS Question
The NPS card displays the count and percentage of Promoters, Passives, and Detractors.
You can click on Promoters, Passives, and Detractors to view the respondents for Promoters, Passives, and Detractors, respectively.
Metrics
Importance
Metrics can help you to measure different parameters across different surveys. These help organizations identify the specific factors or variables that significantly impact the outcomes or behaviors they are trying to understand. These factors are often the "drivers" that influence customer satisfaction, employee engagement, product adoption, or any other key performance indicators.
How to Use
Identify Areas for Improvement: Driver metrics help organizations pinpoint the specific aspects of their products, services, or processes that significantly influence satisfaction or performance. This allows them to focus their efforts and resources on the areas that will have the most substantial impact. With Dropthought, you can also cross-tabulate these drivers or NPS to understand how they correlate.
Prioritize Actions: Users can prioritize their actions and investments by understanding the most influential factors. They can allocate resources to address the key issues rather than spreading efforts thinly across all aspects.
Customized Solutions: Driver metrics can reveal that different factors influence different segments of your audience or customer base. This allows for more customized and targeted solutions to meet the unique needs of various groups.
Measurable Goals: Identifying key drivers enables organizations to set specific, quantifiable goals for improvement. They can track progress by monitoring changes in these drivers over time.
Competitive Advantage: Understanding what factors drive satisfaction or loyalty can be a source of competitive advantage. Your organization can focus on outperforming your competitors in critical areas.
The section summarizes the rating received for various metrics set for the program w.r.t. the NPS ratings.
Segment and Category Analysis
The section summarizes various segments of respondents who have submitted a response and categories (topics) that have been most and least mentioned in their responses.
Segments |
|---|
Top segments: metadata with the highest metrics score Metadata implies the recipient identifiers. In the above example, Nationality and Hired Date are the metadata. Dropthought analyses the highest metric score received for the program’s preferred metric. Further, it looks into the metadata to identify the respondent segments. In the above example, the respondents with high metric scores have Nationality as Comoros, Argentina. And Hired Date as 2022-08022 00:00… |
Bottom segments: metadata with lowest metrics score Metadata implies the recipient identifiers. In the above example, Nationality is metadata. Dropthought analyses the lowest metric score received for the program’s preferred metric. Further, it looks into the metadata to identify the respondent segments. In the above example, the respondents with low metric scores have Nationality as Equatorial Guinea, Malta, and Suriname. |
Categories (Text Analytics) |
|---|
Top Categories: Categories with the highest percentage of positive sentiments Dropthought’s Text Analytics analyzes the response received for the program’s preferred metric question. From the responses, the most common response (could be a term) is derived as Top Categories. In the above example, the top categories are Team Work, Educational Benefits, and Work Hours. |
Bottom Categories: Categories with the highest percentage of negative sentiments Dropthought’s Text Analytics analyzes the response received for the program’s preferred metric question. From the responses, the least common response (could be a term) is derived as Bottom Categories. In the above example, the bottom categories are Retirement Benefits, Workload Redistribution, and Talent Management. |
Overall Sentiment (Text Analytics)
Importance
Sentiment analysis is a valuable Natural Language Processing (NLP) technique that determines and categorizes text data's sentiment or emotional tone. It is essential for understanding and leveraging public opinion and emotions expressed in text data.
How to Use
Customer Feedback Analysis: Sentiment analysis is widely used to analyze customer feedback, reviews, and social media comments. It helps businesses understand customers' feelings about their products, services, and brand. This insight can be used to improve offerings and customer satisfaction.
Brand and Reputation Management: You can monitor sentiment around your brand and products in real time. Identifying negative sentiment will allow you to address issues quickly and protect your reputation.
Competitive Analysis: Understanding sentiment can help your business assess how you compare to competitors regarding customer satisfaction and market perception.
Product/Service Development: Sentiment analysis can provide insights into features or aspects of a product that customers like or dislike, guiding product development and improvement efforts.
Crisis Management: Rapidly detecting negative sentiment can help your organization respond to potential crises or negative public perceptions before they escalate.
Customer Service: Sentiment analysis can be applied to customer service interactions to assess customer satisfaction and identify improvement areas.
The section displays a pie chart with the percentage of overall Positive, Negative, and Neutral ratings received for the program.
Word Cloud (Text Analytics)
Importance
Word clouds are valuable for simplifying and visualizing text data, identifying key themes or trends, and gaining insights from large volumes of unstructured text.
How to Use
Visual Representation: Word clouds provide a visual representation of data, making it easy to spot patterns, trends, and the most frequently mentioned words at a glance.
Highlighting Key Concepts: Word clouds highlight key concepts, themes, or topics within a text, making it easier to identify the main focus of the content.
Data Exploration: Since open-ended feedback is a form of unstructured data, word clouds can be used to explore and understand without pouring over the data one by one in hundreds and thousands of feedback.
Interpretation: You can analyze the word cloud to draw insights. Look for the most prominent words, identify common themes or topics, and better understand the text's content or sentiment.
Actionable Insights: Use the insights from the word cloud to inform decisions or actions. For example, in retail, you can see the common concerns or issues raised in customer feedback and address them with specific, fast actions.
It displays various terms mentioned across all the responses and the occurrences. Users can hover over any of the words to view their occurrences.
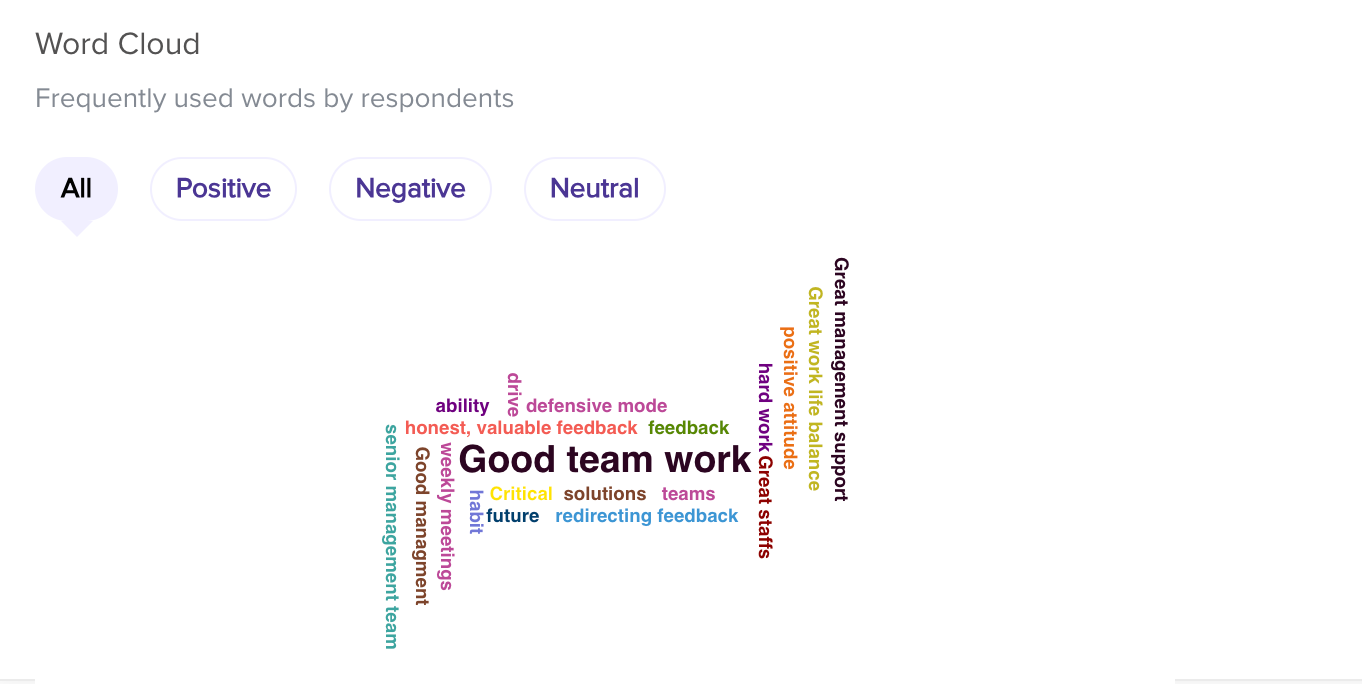
Switch between Positive, Negative and Neutral tabs to view the words that has positive and negative and neutral sentiments respectively, colour coded!